Prepared Exclusively for Elizabeth Gould
August 2026

The LAAA Team has closed 490 transactions totaling $1.55B across 21 states and Washington, D.C., including 340 apartment sales covering 4,668 units.
That record is built on the same discipline applied here: verified rent rolls and operating statements, comparable sales confirmed against recorded deeds rather than aggregator data, and a value conclusion a buyer's lender can follow.


Our public, continuously maintained reach combines active email subscribers, owner and investor contacts, a building-owner database, and targeted direct buyer calls for each listing.
Most brokers are reactive. They post the listing, run an email blast, and wait for the phone to ring. We do all of that, and we do it well. Then we do the part almost nobody does. We pick up the phone.
Before your building goes to market, our system builds a probable buyer list for it specifically. It pulls the county assessment record for every property in the surrounding area: who owns it, where their mail goes, what they paid, when they bought, who financed it, and how many other buildings they hold. Out of that come the three groups most likely to buy your building. Owners of comparable product nearby. Buyers who have closed on buildings like yours recently. Exchange buyers with money that has to be placed on a deadline.
That list runs well over 100 names, and we call every one of them.
This is a proven system and we built it ourselves. It is not a Marcus & Millichap product and it did not come with the brand. Our team designed it, we own it, and we use it on every listing we take.
Sitting on top of it is the part software cannot buy. Careers spanning 20 years of notes on these same buyers. We have their direct numbers and their emails. We know what they bought last, what they passed on and why, and what they are hunting for now. Every seller we take on inherits all of it on day one.
Then we work it. Buyer lists, offer matrices, and a straight answer every week on who called, who toured, and what they said.
The buyer pool for a Palmdale apartment building at this size is narrow and identifiable. Recent closings in the submarket went to two groups: a regional operator buying on yield, and local private capital paying a premium for a clean, stabilized asset. A campaign has to reach both, because they price differently.
Marketing begins only after the value conclusion is agreed. Nothing in this report has been distributed.
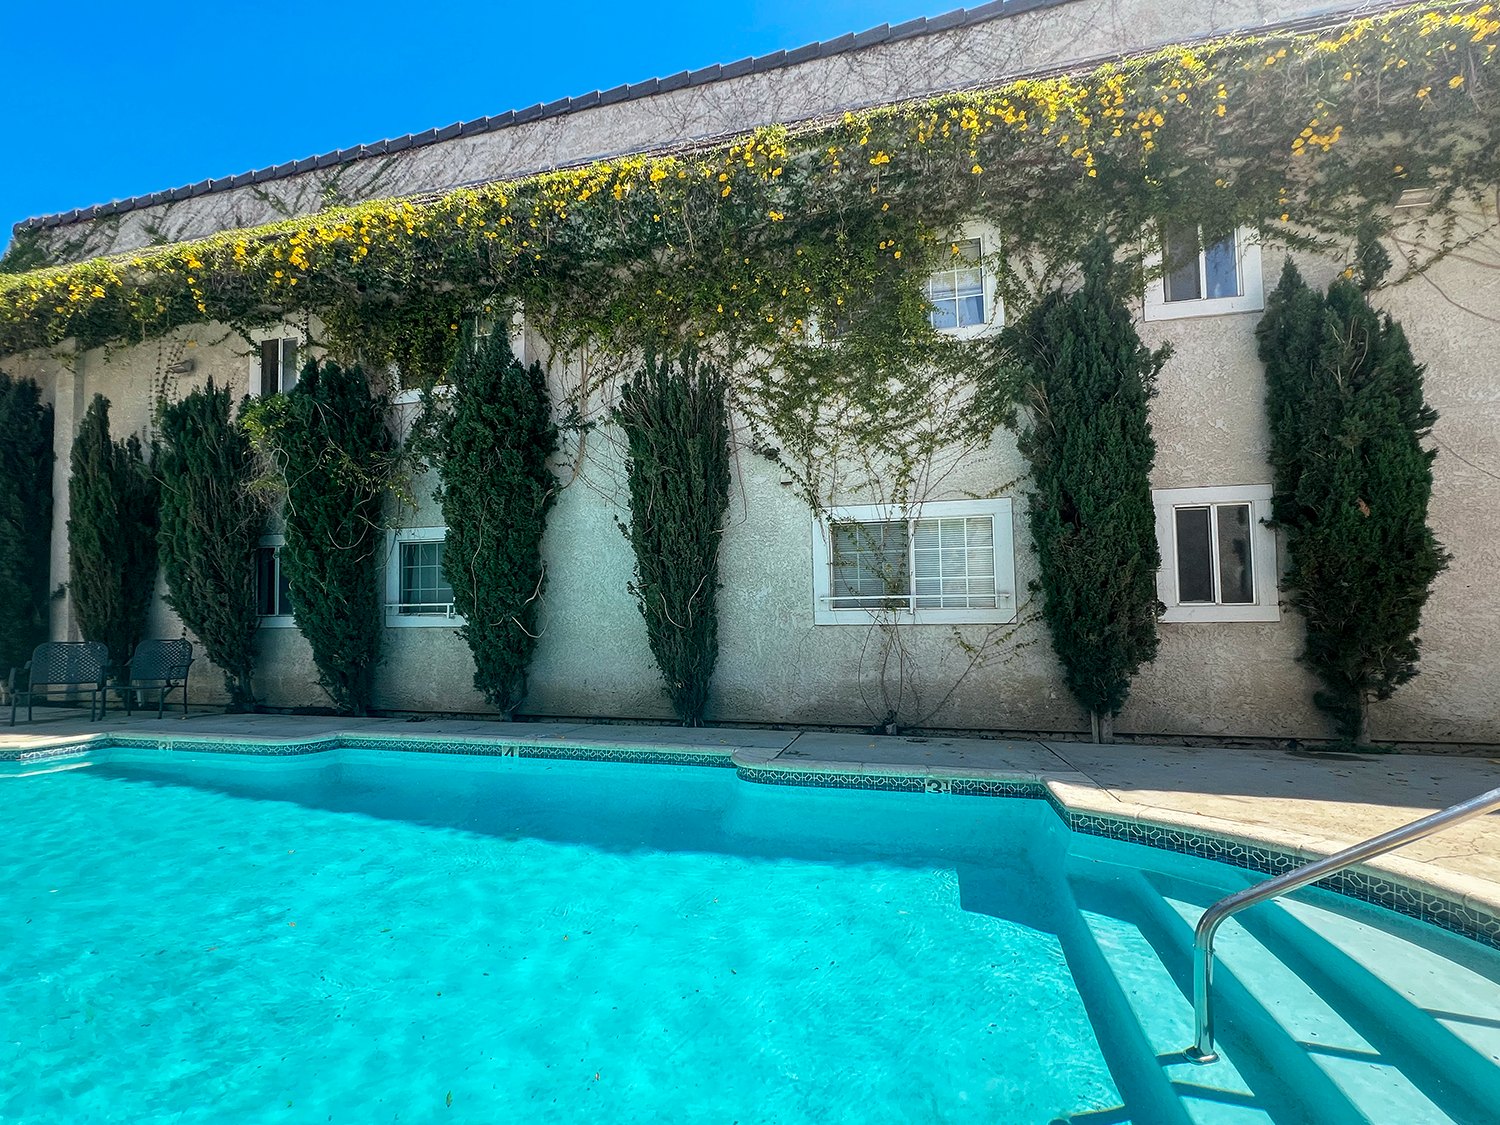
Pinecrest Apartments at 38050 11th Street East is a 32 unit apartment property built in 1989 and held in the same family ownership since 2016. The building contains 26,392 gross square feet on 43,572 square feet of land, with a pool and on-site laundry.
This report values the property on its own merits. It is one of five individual opinions of value prepared for the ownership and carries no portfolio assumption, no blended pricing and no requirement that any other asset transact.
The analysis rebuilds the operating statement on the basis a buyer would actually inherit. Ownership payroll and management company overhead come out, a 4% third-party management fee and the legally required resident manager credit go in, insurance is set at documented cost, and property tax is reassessed at the value conclusion. What remains is the income a new owner underwrites on day one.
Recent closings show two distinct buyers. A regional operator bought four of the six verified sales, financed at or near the full purchase price through a single lender relationship, and priced in a band of roughly $110,000 to $150,000 per unit. The two highest prices in the pool, at $161,111 and $182,353 per unit, went to local private buyers, one of them all cash.
That split is the whole marketing question. The yield buyer sets the floor and will transact quickly. The premium is paid by local private and exchange capital that wants a clean, stabilized building it does not have to fix.

The property sits in East Palmdale, the established rental core of the city, inside the Palmdale Elementary and Antelope Valley Union High School District attendance zones. Gateway Shopping Center is within roughly a mile and the Antelope Valley Mall, Palmdale Regional Medical Center and the Highway 14 corridor are a short drive.
Palmdale is an incorporated city, so Los Angeles City rent stabilization does not apply. Residential rents are governed by the statewide framework under AB 1482.
The 93550 ZIP code carries a population of roughly 81,500 with a median household income near $61,400. Renters occupy about 46% of households and the median gross rent is about $1,457, which places the in-place rents at this property in the working core of local demand rather than at the top of it.
| Property & Location Details | |
|---|---|
| Address | 38050 11th Street East |
| City | Palmdale, CA 93550 |
| APN | 3014-003-026 |
| Year Built | 1989 |
| Building SF | 26,392 |
| Lot Size | 43,572 SF (1.0 ac) |
| Units | 32 |
| Parking | Gated on-site parking with assigned spaces |

| Property Overview | |
|---|---|
| Units | 32 |
| Year Built | 1989 |
| Building SF | 26,392 |
| Lot SF | 43,572 |
| APN | 3014-003-026 |
| Unit Mix | |
|---|---|
| 32x 2BR / 2BA | 825 SF |
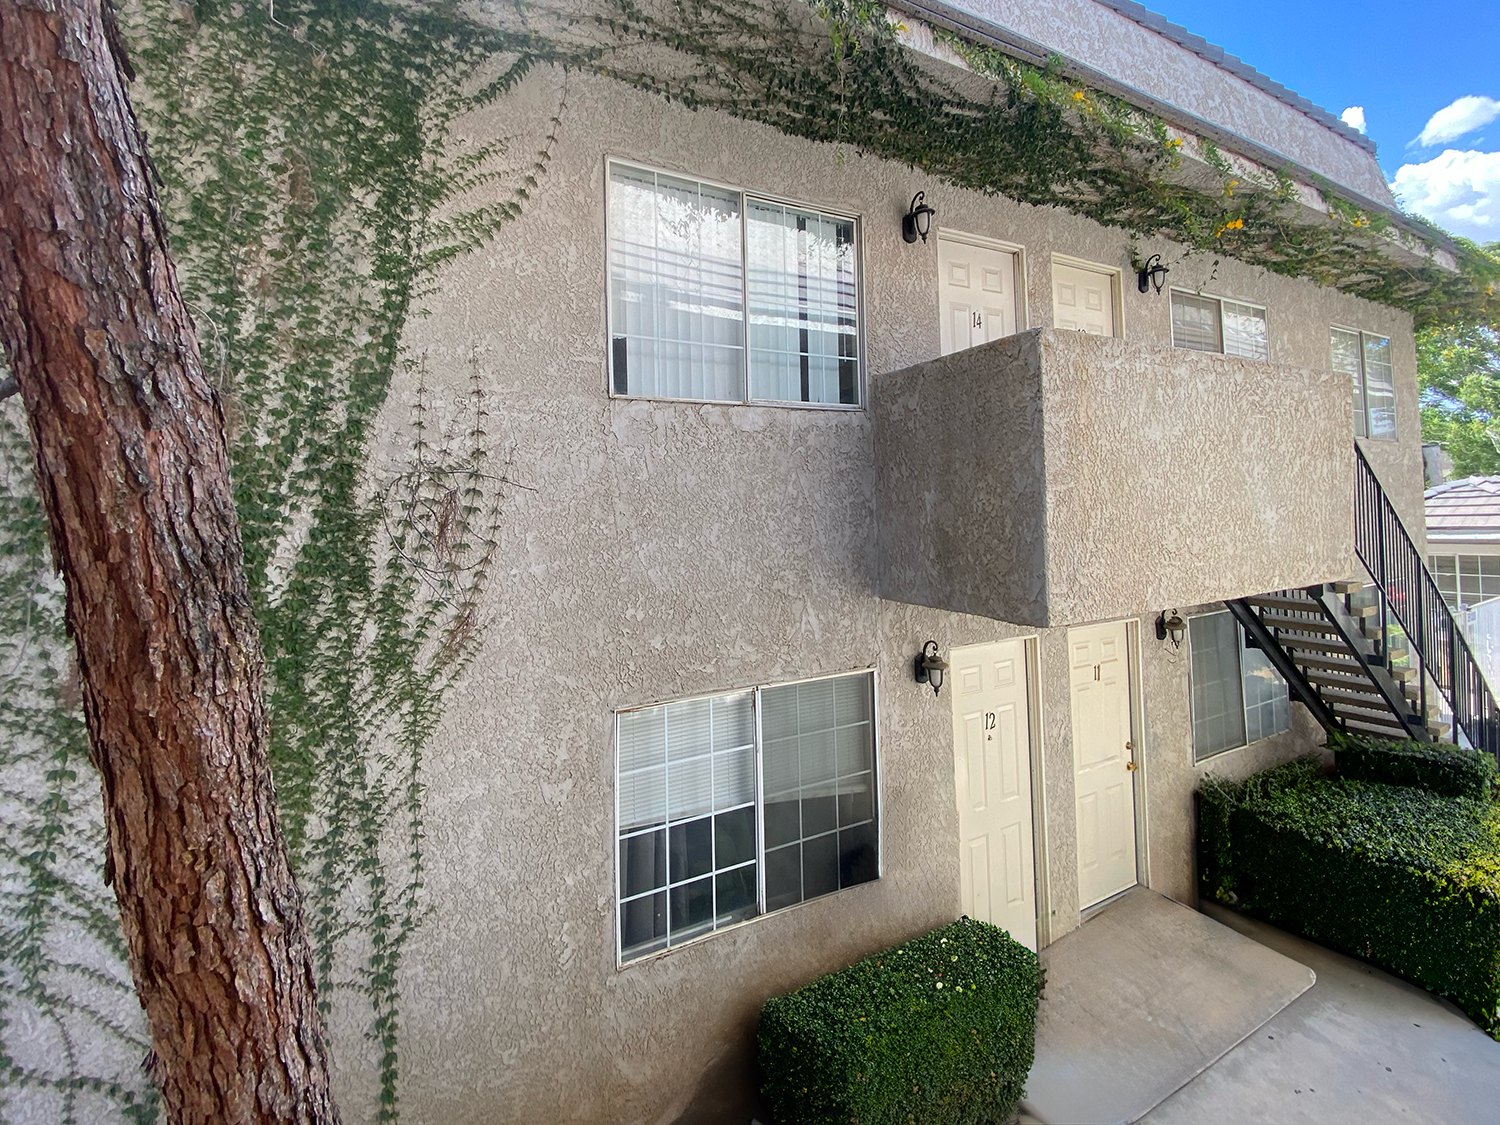
The property is a two story wood frame apartment building of 26,392 gross square feet across 32 units. Gated on-site parking with assigned spaces.
Physical facts here come from the assessment record and current site photography published by the ownership's own management company, and from the June 2026 rent roll for the unit mix. Public amenity flags were not relied on. The pool is a case in point: it is carried in the trailing twelve month operating statement as recurring pool service, and it appears in current site photography, while the public records for this parcel understate it. The operating statement and the photographs are the better evidence.
A physical inspection, a roof and mechanical assessment, and a measured survey remain buyer diligence items. Nothing in this report substitutes for them.
Click any image to enlarge. Images depict the property and representative interiors. Source: listing media and site photography.
Local private and 1031 exchange capital
Antelope Valley owners and Los Angeles basin sellers trading into higher yield. This buyer paid the two highest verified prices per unit in the comparable set and values stabilized occupancy over renovation upside.
Regional multifamily operator
The buyer of four of the six verified comparable sales, financing through a single lender relationship and underwriting to a yield target. Sets the floor of the range and closes quickly.
Owner operator adding to a Palmdale footprint
A smaller private owner already managing in 93550, for whom another building within a few blocks carries genuine operating leverage.
Lead with verified operations
The June 2026 rent roll cross-foots to the printed totals to the dollar and the trailing twelve month statement reconciles line by line. Handing a buyer a reconciled package at launch removes the retrade that usually follows the first week of diligence.
Price to the local private buyer, not the yield buyer
The two highest verified prices per unit in this submarket were paid by local private capital, not by the regional operator that bought most of the volume. The campaign should reach that buyer first.
Show the reassessment honestly
Palmdale sales reassess at effective rates of 1.47% to 1.72%, not the 1.2% county shorthand. Underwriting the real number up front is what keeps a financing contingency from becoming a price reduction.

| Address | Unit Type | SF | Asking Rent | Distance |
|---|---|---|---|---|
| 38722 11th Street East | 2BR 2BA | - | $1,815 | 0.81 mi |
| 38551 11th Street East | 2BR 1BA | - | $1,850 | 0.63 mi |
| 38719 10th Street East | 2BR 1BA | - | $1,650 | 0.86 mi |
| 38110 5th Street East | 2BR | - | $1,625 | 0.57 mi |
| 38572 10th Place East | 1BR 1BA | - | $1,525 | 0.67 mi |
| Average (5 rent comps) | - | $1,693 | 0.71 mi | |
Pro forma rents are set at the highest rent actually achieved at this property for each unit type on the June 2026 rent roll. They are floors supported by signed leases in the building, not projections.
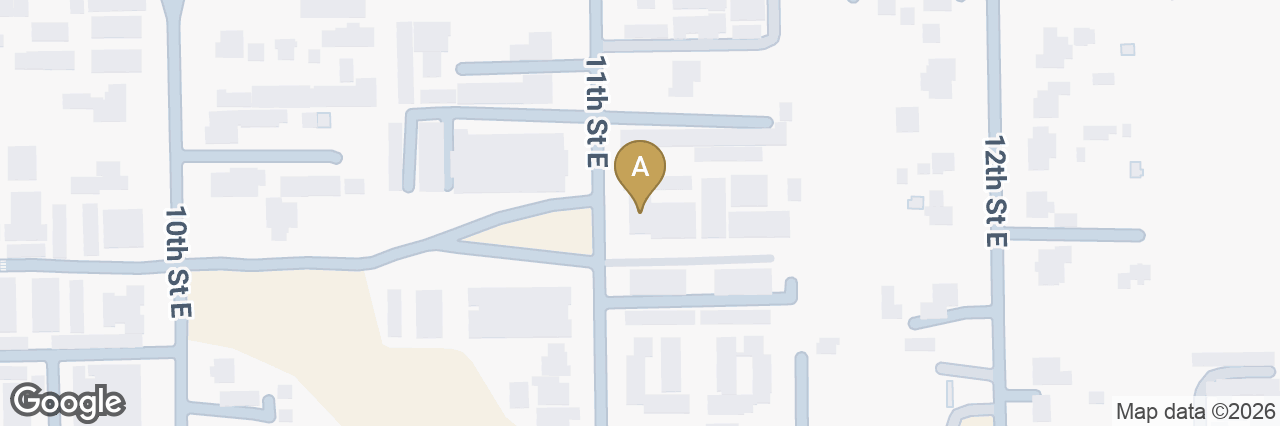
Five current asking rents in the table were accessed on August 4, 2026, and they sit above those floors: two bedroom asks run $1,625 to $1,850 and the one bedroom ask is $1,525. Distances are straight line from this building to each comparable, computed from the same approved coordinates the map is drawn from, and no comparable in the set is more than 0.86 miles away. These are advertised rents rather than signed leases and are shown as market sensitivity only.
The properties shown are Carmel Apartments at 38722 11th Street East, an individually listed unit at 38551 11th Street East, Colonial Terrace at 38719 10th Street East, Shadow Springs at 38110 5th Street East, and an individually listed unit at 38572 10th Place East. Three of them publish a unit size, 38551 11th Street East at 950 square feet, 38719 10th Street East at 800 square feet, and 38572 10th Place East at 850 square feet. The size column reads as a dash because an average struck on 3 of 5 rows would misstate the set. Carmel Apartments is advertising one month free on selected two and three bedroom units, which indicates some concession pressure at the top of the range.
The owner's stated market rent column in this building's rent roll sits below rents the building is already achieving. That column is stale and was not used anywhere in this analysis.

| Address | Yr | Units | Bldg SF | Sale Price | $/Unit | $/SF | GRM | Cap | Date |
|---|---|---|---|---|---|---|---|---|---|
| 38633 Larkin Avenue, Palmdale | 1984 | 18 | 15,266 | $2,400,000 | $133,333 | $157 | - | - | September 5, 2024 |
| 1241 E Avenue R, Palmdale | 1989 | 18 | 19,840 | $2,900,000 | $161,111 | $146 | - | - | July 16, 2024 |
| 937 E Avenue R, Palmdale | 1982 | 32 | 21,960 | $4,400,000 | $137,500 | $200 | - | - | September 10, 2024 |
| 1341 E Avenue R, Palmdale | 1985 | 17 | 18,527 | $3,100,000 | $182,353 | $167 | - | - | December 24, 2024 |
| 4136 W Avenue L, Quartz Hill | 1987 | 27 | 25,648 | $2,970,000 | $110,000 | $116 | - | - | March 13, 2025 |
| 4840 W Avenue L8, Quartz Hill | 1985 | 34 | 27,821 | $5,100,000 | $150,000 | $183 | - | - | November 21, 2025 |
| Median (6 comps) | 20,900 | $3,035,000 | $143,750 | $162 | - | - | - | ||
Six closed apartment sales in Palmdale and Quartz Hill survive verification against recorded deeds and assessment records. Their verified prices run from $110,000 to $182,353 per unit and from $115.80 to $200.36 per square foot. Four of the six closed in 2024 and two in 2025, and the most recent, in November 2025, carries the most weight on current conditions.
Eight further entries pulled in the same search were excluded and the reasons are on file: two affordable housing sales priced on an allocated portfolio basis, a senior conversion, a recreational vehicle park bought for battery storage land, a mobile home park, an undisclosed partnership interest transfer, a triplex portfolio, and one sale that a listing service had entered twice under two addresses.
Building areas reported by the commercial data service were wrong on three of seven apartment sales, by as much as 21%, and one entry described a triplex as an 18 unit building. Every figure in the table below was re-verified before it was used.
1. 38633 Larkin Avenue, Palmdale - Seven one-bedroom and eleven two-bedroom units in East Palmdale, sold out of a trust dissolution. The closest East Palmdale sale on vintage and unit profile. The building was 67% occupied at close with six vacant units, so the price reflects a distressed operating basis and sits at the low end of the range for a stabilized asset.
2. 1241 E Avenue R, Palmdale - An all two-bedroom, two-bath 1989 building with a pool, three blocks from the 11th Street assets. The closest product match in the pool on vintage, unit type and amenity, and it shares the same tax rate area as three of the subjects. An all-cash purchase by a local Palmdale buyer and a smaller asset, so the price per unit carries a small-lot premium.
3. 937 E Avenue R, Palmdale - A stabilized 32-unit, one-bedroom-weighted building in East Palmdale. The best scale and mix analog in the pool for the one-bedroom-weighted assets, and the highest verified price per square foot of any comparable. Smaller average units drive the price per square foot well above the pool median while the price per unit sits below it.
4. 1341 E Avenue R, Palmdale - Sixteen two-bedroom, two-bath townhome units plus one three-bedroom, in five buildings with attached garages. The price per unit ceiling of the verified pool and evidence of what local private capital pays for a superior product. Townhome product with attached garages is a materially better physical profile than any subject and should be read as a ceiling, not a target.
5. 4136 W Avenue L, Quartz Hill - An off-market 27-unit sale in Quartz Hill with deferred maintenance and four vacant units. The verified floor of the range and the reference point for what a buyer pays when condition and occupancy are impaired. Off-market, deferred maintenance, and rents described as well below market. Every metric on this sale carries a condition discount.
6. 4840 W Avenue L8, Quartz Hill - Ten one-bedroom and twenty-four two-bedroom units with a pool, and the most recent arm's length apartment sale in the Antelope Valley comparable set. The freshest transaction in the pool and the one carrying the most weight on current market conditions. A superior west-side Quartz Hill location and six vacant units at close. The location premium argues for pricing the East Palmdale assets below this price per unit.

| Address | Yr | Units | Bldg SF | List Price | $/Unit | $/SF | GRM | Cap | Date |
|---|---|---|---|---|---|---|---|---|---|
| 518 E Avenue Q-12, Palmdale | 1980 | 30 | 22,000 | $5,100,000 | $170,000 | $232 | - | - | Listed July 6, 2026 |
| 38225 9th Street East | 2026 | 31 | 46,500 | $11,250,000 | $362,903 | $242 | - | - | Listed June 8, 2026 |
| Median (2 comps) | 34,250 | $8,175,000 | $266,452 | $237 | - | - | - | ||
518 E Avenue Q-12, Palmdale - Pine Grove Casitas. Thirty units renovated in 2025 and offered at $5.1M, publicly listed as of August 4, 2026. The only current Palmdale offering close to the subject size class.
38225 9th Street East - Sierra Heights Townhomes. Thirty-one new two-bedroom, two-and-a-half-bath townhomes of about 1,500 square feet with garages, balconies and in-unit laundry, publicly listed as of August 4, 2026. Shows the ceiling of new construction pricing in the same submarket and the gap a buyer of existing product is buying below.
| Units | Type | Approx SF | Current Rent | Current Monthly | Market Rent | Market Monthly |
|---|---|---|---|---|---|---|
| 32 | 2BR / 2BA | 825 | $1,589 | $50,848 | $1,745 | $55,840 |
| Total Scheduled Rent | $1,589 | $50,848 | $1,745 | $55,840 | ||
| Additional Income | - | $912 | - | $912 | ||
| Monthly Scheduled Gross Income | - | $51,760 | - | $56,752 | ||
| Current | Market | |
|---|---|---|
| Scheduled Gross Income | $621,120 | $681,024 |
| Vacancy Reserve at 6.0% | ($36,611) | ($40,205) |
| Gross Operating Income | $584,509 | $640,819 |
| Operating Expenses | ($264,673) | ($267,069) |
| Net Operating Income | $319,836 | $373,750 |
| Loan Payments | ($196,096) | ($196,096) |
| Pre-Tax Cash Flow | $123,740 | $177,654 |
| Principal Reduction | $29,759 | $29,759 |
| Total Return Before Taxes | $153,499 | $207,413 |
| Current | Pro Forma | |
|---|---|---|
| Property Tax[1] | $79,325 | $79,325 |
| Insurance[2] | $42,400 | $42,400 |
| Utilities[3] | $49,943 | $49,943 |
| Repairs & Maintenance[4] | $23,200 | $23,200 |
| Management Fee[5] | $24,407 | $26,803 |
| On-Site Manager Rent Credit[6] | $20,940 | $20,940 |
| Landscaping, Pest & Life Safety[7] | $8,458 | $8,458 |
| Pool Service[8] | $3,200 | $3,200 |
| Administrative[9] | $3,200 | $3,200 |
| Reserves[11] | $9,600 | $9,600 |
| Total Operating Expenses | $264,673 | $267,069 |
| Expense Ratio | 45.3% | 41.7% |
| Per Unit | $8,271 | $8,346 |
| Per Square Foot | $10.03 | $10.12 |
[1] Property Tax: Reassessed at the value conclusion using the effective rate observed on recently reassessed Palmdale sales in the same tax rate area, not the Los Angeles County default. Direct assessments carried on the current bill are inside this figure.
[2] Insurance: $1,325 per unit, earthquake coverage excluded. The owner's trailing twelve month premiums across the five properties average $1,329 per unit, so this reflects documented cost rather than a broker estimate.
[3] Utilities: The owner's trailing twelve month actuals for the utilities this ownership pays, carried forward without adjustment. Tenant-paid utilities are not added back.
[4] Repairs & Maintenance: A transferable allowance of $725 per unit, or $800 at the 1971 asset. It replaces the seller's maintenance payroll, contract labor, painting, supplies and turnover accounts, which are structured around a portfolio maintenance crew a buyer does not acquire.
[5] Management Fee: 4% of gross scheduled rent, the LAAA standard for third-party management at this size. The seller's own management company fee and office payroll are removed rather than carried alongside it.
[6] On-Site Manager Rent Credit: California requires a manager residing on site at buildings of 16 or more units. The manager unit is carried at market rent in gross scheduled rent and the credit is shown as a separate expense. It is never folded into the management fee.
[7] Landscaping, Pest & Life Safety: The owner's trailing twelve month actuals for landscaping, pest control, fire extinguisher service and security, which transfer with the property.
[8] Pool Service: $100 per unit where the trailing twelve month statement carries pool service spend. Where there is no pool the line is zero.
[9] Administrative: $100 per unit, or $75 at the 76 unit asset. It consolidates accounting, routine legal, bank charges, licensing and office costs into one transferable figure.
[11] Reserves: A replacement reserve set per property against building age and condition. It is not an expense the seller currently books; it is underwritten because a buyer's lender will require it.
Owner-reported figures are unaudited. A buyer should verify all income and expenses in due diligence.
| Operating Data | |
|---|---|
| Price | $4,750,000 |
| Number of Units | 32 |
| Price per Unit | $148,438 |
| Price per SF | $179.98 |
| Current GRM | 7.78 |
| Market GRM | 7.09 |
| Current Cap Rate | 6.73% |
| Market Cap Rate | 7.87% |
| Proposed Financing | |
|---|---|
| Loan Amount | $2,612,500 |
| Down Payment | $2,137,500 |
| Interest Rate | 6.40% |
| Amortization | 30 years |
| DCR | 1.63 |
Value is concluded from verified price per unit and price per square foot. That is a deliberate choice. None of the six comparable sales comes with an offering memorandum or a verified operating statement, so any cap rate attached to them would be a broker reported figure rather than a measured one. Commercial data services routinely carry a list price marketing cap onto a closed record and derive the income from it, which makes the arithmetic self-consistent and the conclusion meaningless.
At $4.75M, the property prices at $148,438 per unit and $179.98 per square foot. The supporting evidence is C2 at 1241 E Avenue R and C6 at 4840 W Avenue L8.
The cap rate and gross rent multiplier shown in the summary are calculated from this report's own reconstructed operating statement at the concluded value, with property tax reassessed. They are cross-checks on the conclusion, not the basis for it.
Supported value range: $4,450,000 to $4,850,000
This Broker Opinion of Value is an opinion prepared for the owner. It is not an appraisal and is not a guarantee of sale price.
Operating figures are drawn from the owner's June 2026 rent roll and the trailing twelve month statement for July 2025 through June 2026. Annual columns were used throughout; individual monthly cells in the scanned statements carry optical character recognition damage and were not relied on.
Expenses are presented on a buyer-normalized basis. Ownership payroll and management company overhead are replaced with a 4% third-party management fee, a separate resident manager rent credit required at 16 or more units in California, insurance at $1,325 per unit excluding earthquake coverage, and reserves. Property tax is reassessed at the value conclusion using effective rates observed on recently reassessed Palmdale sales, not the county default.
Unit square footages are an allocation of the assessor-verified gross building area across the rent roll unit mix, weighted by bedroom count. They are not a measured survey and will differ from advertised unit sizes.
Comparable sale prices, dates, unit counts and building areas were verified against recorded deeds and assessment records. Cap rates and gross rent multipliers reported by commercial data services on those sales were not independently verified and are deliberately excluded.
The collection loss line combines a 3% physical vacancy allowance with a credit loss allowance of 2% to 3% calibrated to this property's trailing delinquency. The operating table shows the two combined as a single reserve; it is not a 5% or 6% physical vacancy assumption.
Rent comparables reflect current public asking rents accessed on August 4, 2026. Asking rents are not signed leases and are shown as market sensitivity only. Distances are straight line from the subject, computed from the same approved rooftop coordinates used to render the maps, and are not driving distances.
Flood and earthquake fault findings were revalidated on August 4, 2026. Fire hazard severity, landslide susceptibility and environmental screening data were unavailable at that date and are not stated in this report.